
One of the coolest technical developments in neuroscience during the last decade has been driven by 3D electron microscopy (3D EM). This allowed to cut large junks of small brains (or small junks of big brains) into 8-50 nm thick slices, which are then imaged with nanometer resolution, resulting in 3D stacks of imaged tissue. Here, I want to highlight some of those datasets which are easily accessible in the internet but, at least from my impression, under-used by other researchers.
But also the technical concepts and breakthroughs underlying 3D EM are very interesting. The three main approaches, serial block-face electron microscopy (SBEM), serial section transmission or scanning electron microscopy (ssTEM or ssSEM) and focused ion beam SEM (FIB-SEM) have been very nicely reviewed by a colleague of mine, Benjamin Titze, including some very beautiful and instructive figures (special recommendation for Fig. 4). Of course, this is only a part of the challenge: First, the brain tissue must be stained with heavy metals to be visible for electrons. Second, after data acquisition, human annotators or algorithms have to extract neuronal morphologies or synapse distributions from the huge datasets.
However, I find the raw 3D EM data very interesting by itself. Those datasets are still rare, but many people do not know that some of them are easily accessible to anyone with an internet connection. And it is a true pleasure to have the full screen filled with the overwhelming clutter of neuronal dendrites and to follow them in 3D just by scrolling with the mouse.
Neurodata.io is probably the best place to start. After a simple registration, one can directly access some of those EM datasets in the browser: ndwebtools.neurodata.io/coll_list, or through other tools. Not all of the datasets are of the highest quality (and it is not always easy to judge data quality for a lay person), but most of them offer highly interesting views into the complexity of the brain (scroll wheel for going through the slice, ctrl + scroll wheel for zooming). Here I want to highlight a few of them. They can be accessed by clicking on the neurodata/ndwebtools link above.
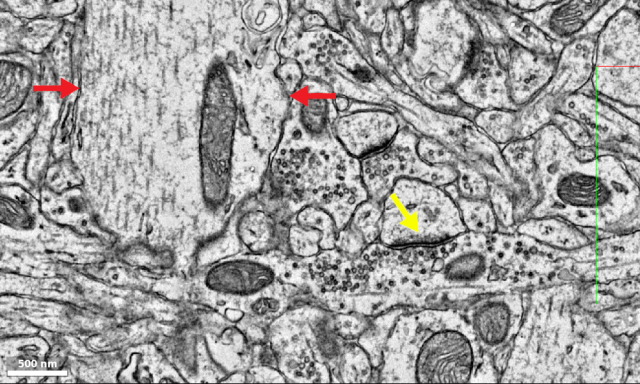
The following excerpt by Lee et al. (2016) shows a small zoom-in into the somato-sensory cortex in mouse. A thick dendrite (between the red arrows) is passing vertically through the image. In this ssSEM datasets, synapses look really nice (yellow arrow, with a beautiful vesicle cloud below), but they look even nicer in 3D, so you should have a look at the 3D data yourself.
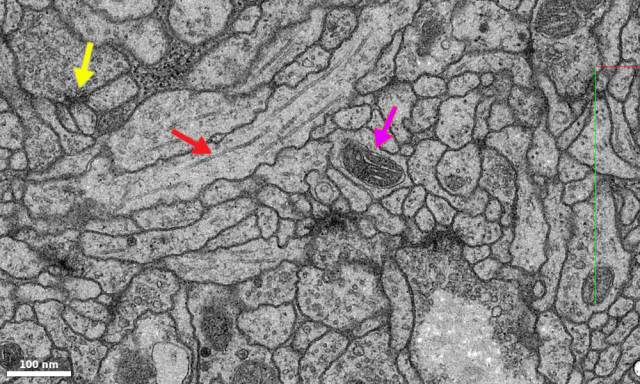
The following picture from a dataset from the Cardona lab shows a small zoom-in of the drosophila brain. (I assume that the scale bar generated for this dataset is a bit off; the 100 nm shown here probably correspond to 500 nm.) The red arrow highlights a filament of the cytoskeleton, probably a microtubule in charge of transport along the dendrite. The pink arrow indicates one of the many mitochondria with its cristae. The yellow arrow indicates a local darkening at the contact site between two neurites, and I have no idea what this is. A gap junction? A strange synapse? A precipitate, i.e., an artifact of the staining procedure?
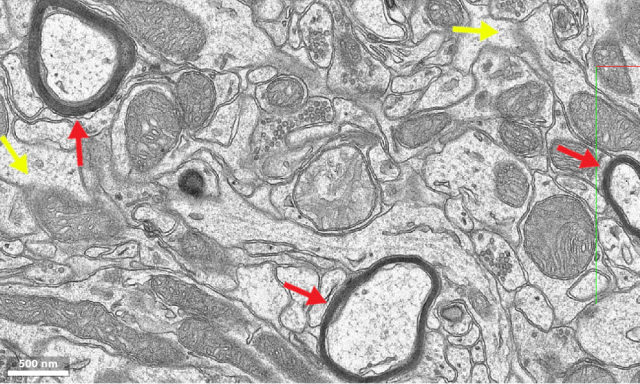
In hippocampus CA1, things look very similar, in a ssTEM dataset used by Bloss et al. (2018). This study focuses on clustering of synapses from single axons. Axons can easily be recognized by their dark and thick myelin sheath (red arrows). If you have a lot of time, you can scroll through the dataset and try to find a node of Ranvier. – As in almost every 3D EM dataset, there are planes or entire regions with low quality staining or low signal to noise imaging or something else that went wrong. Sometimes this is very local, just a blurring of boundaries (yellow arrows) that is difficult to interpret.
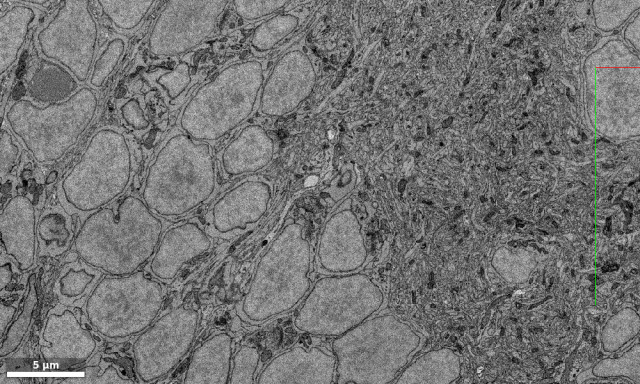
And here is a zoomed-out view of a single plane of a dataset by Wanner et al. (2016) of the olfactory bulb of larval zebrafish. Here, the large roundish shapes are not cross-sections of dendrites, but neuronal somata:
I just want to encourage people to browse through these datasets. Browsing in 3D is much more interesting than watching these still images. – Or if you are teaching students about neuroscience, why not send them a link such that they can discover neurons themselves by scrolling and zooming through the brains? I haven’t seen many people who were not fascinated when first encountering 3D EM data and who were not overwhelmed by the sheer amount of dendritic arborizations! (And this is a bit funny, if we keep in mind that electron microscopy does not see much of the more complex level of cells, the crowded microenvironment, which is a chaos of competing, interacting, diffusing little protein machines.)
As an alternative to neurodata.io that is accessible even without any registration, a couple of test datasets are available with neuroglancer, a rendering software developed by Google. Check out the dataset from Takemura et al. (2015) by following this link. It is an isotropically resolved dataset (8 nm in x, y and z). You can use the scroll wheel and ctrl to browse through the stack or to zoom in and out. The software includes three EM viewports and an additional rendering of a number of selected neurons.
Another way to explore 3D EM data is to go to eyewire.org, where one can discover 3D EM datasets of neurons (retina, based on Briggman et al., 2011) within the framework of a game – which is fun. Over the last couple of years, the user interface has become very pleasant. The downside compared to the other options is that one cannot discover freely in a big dataset; plus, there is no labeling of the inner organelles or vesicles of the neurons, which is part of the fun for the other datasets.
To understand more details about these EM images, I found it interesting to go through the first chapter of the book Dendrites (“Dendritic structure”), which can accessed almost to its full extent via Google Books.
Full disclosure: my current host lab is working on 3D EM data in zebrafish. My own projects do not involve electron microscopy directly.

Pingback: Displaying the hippocampus as EM image on the office wall | A blog about neurophysiology