
It is fascinating how much data quality can vary between different calcium imaging data sets. In this blog post, I will discuss a metric to quantify and compare data quality and in particular shot noise between calcium imaging datasets.
This variation of data quality depends on potential artifacts due to movement or instrument noise, the frame rate of the microscope, and the flux of fluorescence photons. The photon flux determines the shot noise level for each neuron and therefore whether calcium transients due to action potentials can be detected from the recording. Photon flux depends on factors such as neuron size (in pixels), indicator expression levels, and baseline brightness. As a result, it varies not only between recordings but also across neurons within the same session.
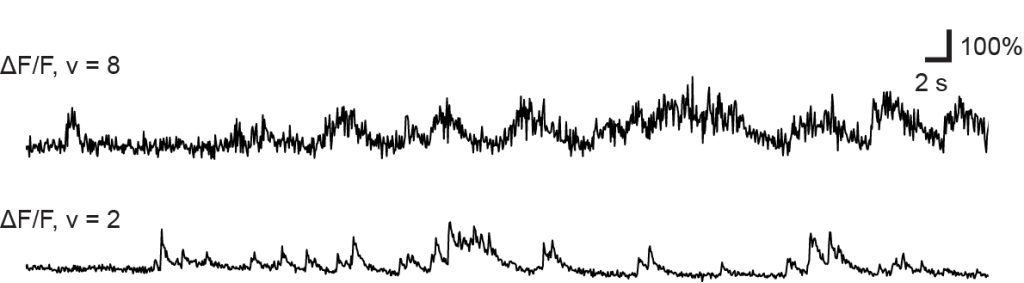
Two example ΔF/F traces from neurons of high (“8”) and low (“2”) standardized noise levels. Examples taken and modified from Rupprecht et al. (2025), under CC BY 4.0 license.
In our 2021 study on spike inference from calcium imaging data with CASCADE (Rupprecht et al., 2021), we took advantage of the fact that the slow calcium signal is typically very similar between adjacent frames. Therefore, the noise level can be approximated by

The median excludes outliers due to fast onset dynamics of calcium signals. Normalization by the square root of the frame rate 
However, this metric is to some degree biased, as it assumes the ideal scenario of zero neuron activity. In the presence of neuronal activity, however, the ups and downs of calcium transients will increase the apparent noise level systematically. Recently, David Hildebrand brought up this issue, and I decided to look into it more carefully.
I used ground-truth spike patterns from electrophysiological recordings of cortical pyramidal neurons (mouse visual cortex, see Fig.2 Suppl.1), convolved them with a linear calcium kernel, and added Gaussian noise of known magnitude. Then, I quantified how precisely 
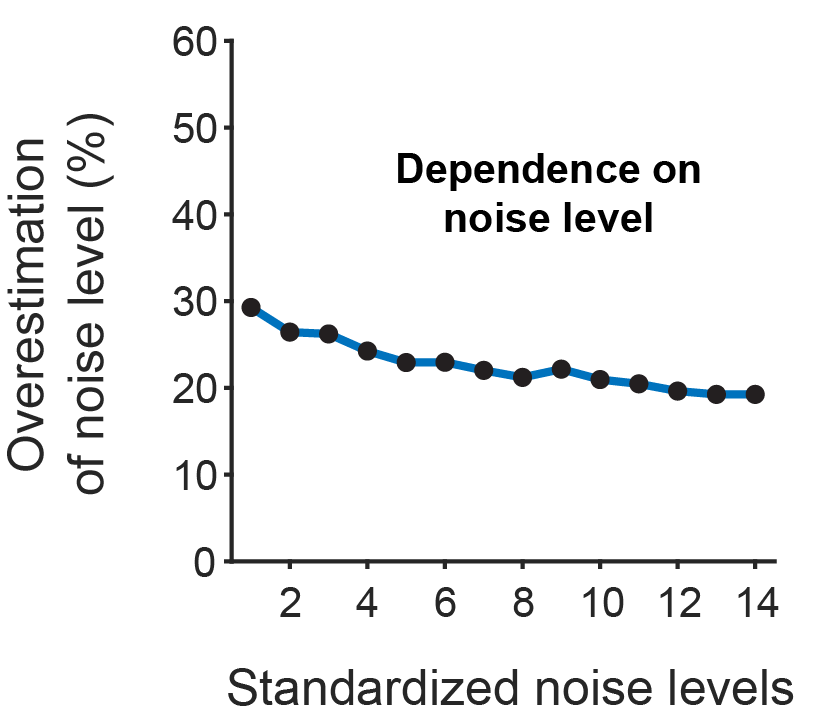
First, the metric generally overestimated the true noise level by about 20%. This overestimation was largely independent of the noise level but slightly increased for lower noise level. This makes sense: the relative effect of the same amount of a fixed level of neuronal activity is greater when the baseline noise is zero. However, the overall effect was relatively small – 20% is not dramatic for such a coarse metric:
Second, for low frame rates, the overestimation became more substantial, reaching up to 50% on average for a frame rate of 1-2 Hz. This is a significant bias that should be kept in mind. If you use the metric

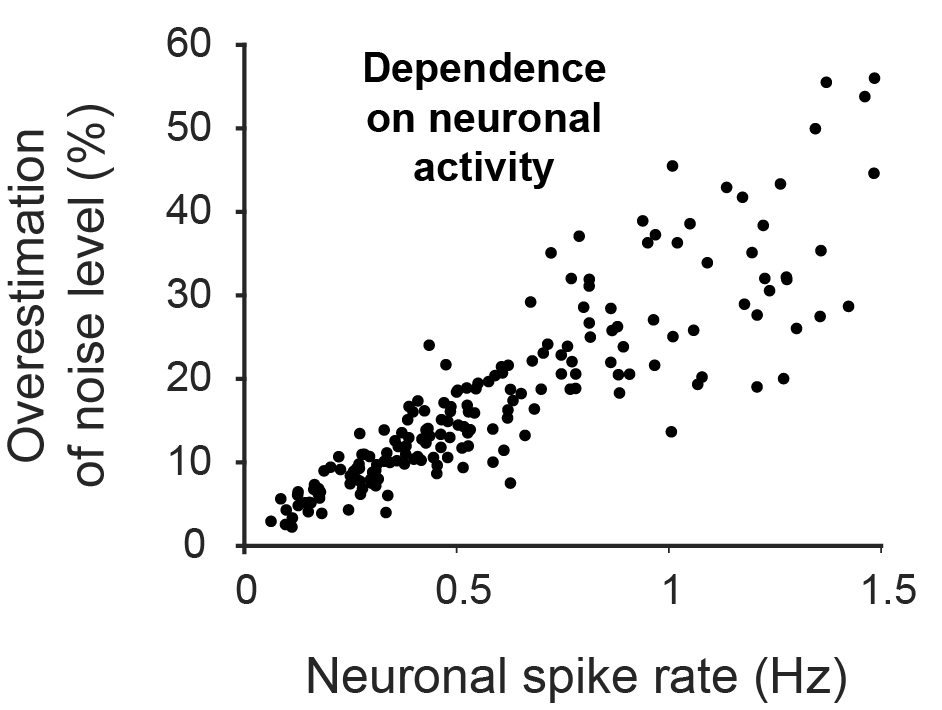
Finally, the overestimation also depended on the true spike rate of the respective recording. In the plot below, each point represents the quantification derived from the ground truth recording of an individual neuron with a its specific spike rate. As one would expect, the overestimation of noise levels is minimial for neurons that are almost silent, and grows almost linearly with the true spike rate:
Altogether, I still believe that the standardized noise level
