
Before I first dived into experimental neuroscience, I imagined whole-cell voltage clamp recordings to be the holy grail of precision. Directly listening to the currents that take place inside of a living neuron! How beautiful and precise, compared to poor-resolution techniques like fMRI or even calcium imaging! I somehow thought that activation curves and kinetics as recorded by Hodgkin and Huxley could be easily measured using voltage clamp, without introducing any errors.
Coming partially from a modeling background, I was especially attracted by the prospect of measuring both inhibitory and excitatory inputs (IPSCs and EPSCs) that would allow me to afterwards combine them in a conductance-based model of a single neuron (or even a network of such neurons). Here I will write about the reasons why I changed my mind about the usefulness of such modeling efforts, with a focus on whole-cell recordings of the small (5-8 μm diameter) zebrafish neurons that I have been recording from during the last year.
Let’s have a look at the typical components (=variables) of the conductance-based neuron model.

Measured quantities: Membrane capacity 


Unfortunately, a simple order of magnitude estimate of the parameters is not good enough to make an informative model. Therefore I will in the following try to understand: When measuring these variables, how precise are these measurements and why?
First of all, it took me a long time to understand that there is a big difference between the famous voltage-clamp experiments performed by Hodgkin and Huxley and those done in the whole-cell configuration. H&H inserted the wire of the recording electrode into the giant axon (picture to the left, taken from Hodkin, Huxley and Katz, 1952). In this configuration, there is basically no resistance between electrode and cytoplasm, because the electrode is inside of the cell.
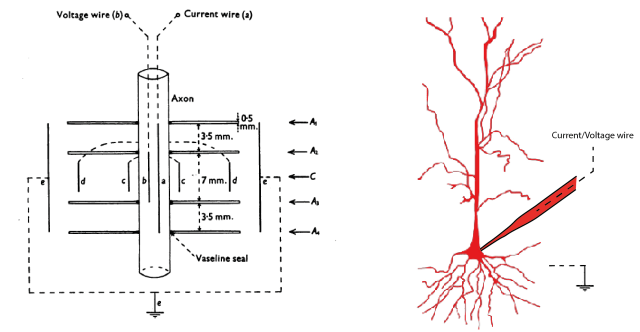
In whole-cell recordings, however, the electrode wire is somewhere inside of the glass pipette (picture on the right side). The glass pipette is connected to the cell at a specific location via a tiny opening that allows voltages to more or less equilibrate between cytoplasm and pipette/electrode. This is the first problem:
1. Series resistance. Series resistance 
Series resistance makes voltage clamp recordings bad for two reasons: First, the signals are lowpass-filtered with a time constant given by 

2. Space clamp. There is only one location which is properly voltage-clamped in the whole-cell mode, and this is the pipette itself. The cell body voltage is different from the pipette potential because of the series resistance (Ohm’s law). The voltage clamp in the dendrites is even more impaired by electrical resistance between the dendrites and the soma. Therefore, voltage clamp at a membrane potential close to the ‘resting potential’ (-70 mV … -50 mV) is more or less reliable; whereas voltage clamp for recording of inhibitory currents (0 mV … +20 mV) is less reliable for the dendritic parts, especially if the dendrites are small. To make things worse, the resistance between soma and dendrites is not necessarily constant over time. Imagine a case where inhibitory inputs open channels at the proximal dendrite. In this case, the electric connection between soma and the distal end of the dendrite will be impaired, and voltage clamp will be worsened as well. Notably, this worsening of voltage clamp would be tightly correlated to the strength of input currents.
In neurons that are large enough to record with patch pipettes both from soma and dendrites, one can test the space clamp error experimentally. And it is not small.
If there are active conductances involved, the complexity of the situation increases even further. In a 1992 paper on series resistance and space clamp in whole-cell recordings, Armstrong and Gilly conclude with the following matter-of-fact paragraph:
“We would like to end with a message of hope regarding the significance of current measurements in extended structures, but we cannot. Interpretation of voltage clamp data where adequate ‘space clamping’ is impossible is extremely difficult unless the membrane is passive and uniform in its properties and the geometry is simple. (…)“
3. Seal resistance. The neuron’s membrane potential deviates from the pipettes potential by a factor that depends on series resistance. Both can be measured and used to calculate the true membrane potential. But there is a second confounding resistance, the seal resistance. Usually, it is neglected, because everything is fine if the series resistance remains constant over the duration of the experiment. But if one needs absolute and not only relative measurements of membrane resistance, firing threshold etc., seal resistance needs to be considered, especially in very small cells. In a good patch, the seal resistance is around 10 GΩ or more. But sometimes it is also a little bit less, maybe 5-8 GΩ. For small neurons, the membrane resistance can be in the same order of magnitude, for example 2-3 GΩ (and yes, I’m dealing with that kind of neurons myself). Seal resistance and membrane resistance therefore divide the applied voltage increase the injected current for a given voltage step [thanks for pointing out this correction, Emily Maverick], leading to voltage errors and wrong measurements of membrane resistance (see also this study). With 


4. The true membrane potential. The recorded membrane potential (say, the ‘resting membrane potential’, or the spiking threshold) is not necessarily the true membrane potential. First, series resistance introduces a systematic error – this is ok, it can be understood and accounted for. It is more difficult to correct for the errors induced by seal resistance, as mentioned. One way to avoid leaks due to break-in is perforated-patch recordings, which is however rather difficult, and probably impossible to combine with small pipette tips that are required for the small neurons I’m interested in.
In addition, I always asked myself how well does my internal solution match the cytoplasm of my neurons in terms of relevant properties. Of course there are differences. But do these differences affect the membrane potential? I don’t see how this could be found out.
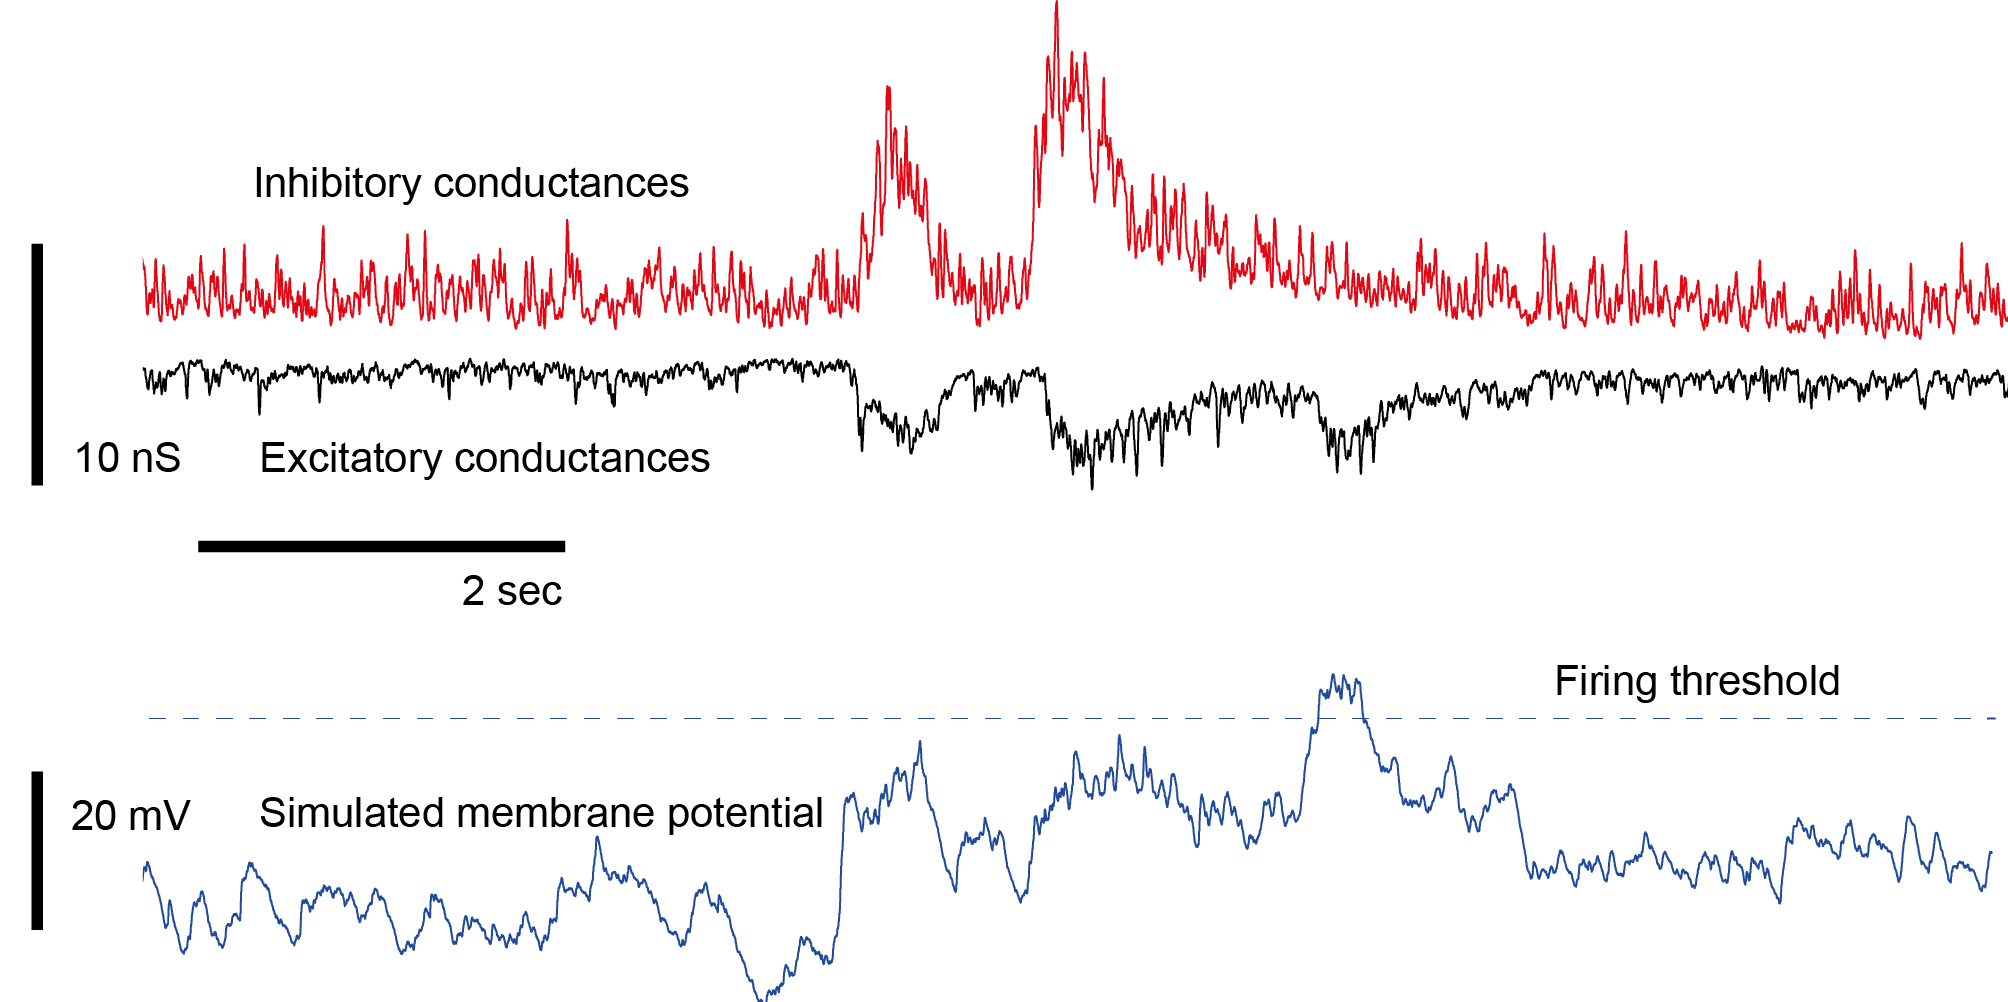
5. Correlation of inhibitory and excitatory currents. During voltage-clamp, one can measure either inhibitory or excitatory currents, but not both at the same time. If everything was 100% reproducible, repeating the measurements in separate trials would be totally ok, but this is not the case. Instead, fluctuations of inhibitory and excitatory currents are typically correlated, although it is unclear to which degree. A way to navigate around this problem is to ignore it and simply work with averages over trials (as I did in the simulation at the beginning of my post). Another solution is to use highly reproducible and easy-to-time stimuli (electrical or optogenetic stimuli, acoustic stimuli) that lead to highly reproducible event-evoked currents. However, this also cannot help understand trial-to-trial-co-variability of excitation and inhibition and similar aspects that take place on fast timescales. There are studies that patch two neighbouring neurons at the same time, measuring excitatory currents from the one and inhibitory from the other neuron, but this is not exactly what one wants to have.
There is actually a lack of a techniques that would allow to observe inhibitory and excitatory currents in the same neuron during the same trial, and this lack is creating a lot of uncertainty about how neurons and neuronal networks operate in reality.
All in all, this does not sound like good news for whole cell voltage clamp experiments. One problem I’m particularly frustrated about is that for many of these systematic errors there is no ground truth available, and it is totally unclear how large the errors actually are or how this could be found out.
However, for many problems, whole-cell patch clamp is still the only available technique, despite all its traps and uncertainties. I’d like to end with the final note of the previously cited paper by Armstrong and Gilly:
“[A]nd the burden of proof that results are interpretable must be on the investigator.”
At this point, a big thank you goes to Katharina Behr from whom I learned quite some of what I wrote down in this blog post. And of course any suggestions on what I am missing here are welcome!

Pingback: Whole-cell patch clamp, part 1: introductory reading | A blog about neurophysiology
Very nice discussion. For an example of simultaneous measurement of excitatory and inhibitory currents, see Cafaro and Rieke (2010). Not perfect, but instructive nonetheless.
Hi John — interesting paper, I didn’t know it before. Funnily, I had tried this method (rapidly switching the holding potential between V_I and V_E) some time ago, but active conductances made any switching event something very strange and dominated by artifacts – maybe that was less of an issue for the retinal ganglion cells used in this study. And for input dynamics / noise correlations on a timescale < 10 ms, the method does not work anyway, unfortunately. But interesting nonetheless …
Pingback: Blue light-induced artifacts in glass pipette-based recording electrodes | A blog about neurophysiology
Pingback: Whole-cell patch clamp, part 4: look and feel | A blog about neurophysiology
Great summary of some of the errors I am discovering as an electrophysiologist! Quick clarification though: In all the circuit diagram equivalents I’ve seen, membrane resistance and seal resistance are in parallel. If that’s the case they would divide the total measured current, not the voltage. This would matter for someone crazy enough (definitely not me……) to try and correct for seal resistance error.
Hi Emily, you’re totally right! I changed the sentence in the text accordingly.
For the example calculation, I was already assuming a parallel configuration of the two resistances, so this part did not need to be corrected :-)
I should not have changed the wording without thinking, it did not make sense at all … but now it should be ok, finally!