
For quite some time, I was unsure about the reasons why images degrade when going to deeper layers with 2P point scanning. This also has remained largely unclear to me until the present point, after having done the estimates presented below, but at least now I’m getting a feeling for it.
The first difficulty lies in estimating whether the degradation comes from a degradation of the excitation PSF, or from low signal due to fluorescent photons that do not reach the detector due to scattering. The mean free path is around 200 um for the IR excitation light, and around 50 um for the to-be-detected visible light. Scattering most likely occurs in the forward direction, indicated by an anisotropy parameter of g ~ 0.9 in almost all brain tissues. There’s a paper by Dong, Koenig and So (2003), coming to the conclusion that scattering does not strongly affect the PSF. Is this due to the 63x objectives with low working distance that they used? (I guess not.) At least I could not believe that this is the normal case. Therefore, I injected fluorescent beads in living brain tissue of adult zebrafish and measured the PSF FWHM using a 20x NA=1.0 waterdipping objective. The axial FWHM at the surface was around 3.0-3.5 um (not completely overfilled back aperture and suboptimal alignment), and remained around 3.5 to 4.5 for the next 50-100 um. At 150-200 um depth, the FWHM had increased to 8 um. In 300 um depth below the surface, quite a strong astigmatism became apparent, coupled with a FWHM > 10 um. Even for small cells in zebrafish, I’ve done imaging in this depth before, but a FWHM of 10 um is far from giving nice images. The astigmatism might be due to the curved surface of the brain, but I did this measurement only at one position, so it can also be due to other inhomogeneities in the brain above the area of interest.
If I’m using a high-NA=1.0 objective to focus in 300 um depth, the central part of the beam will go through 300 um of tissue, whereas the outermost photons of the incoming light cone have a in-tissue-path of 300/cos(asin(1/n)) um ~ 450 um. In average, these photon will have been scattered twice before they reach the focus of the PSF.
What would we expect from theoretical calculations? To get a feeling for this, I did some very, very crude Monte Carlo scattering simulations. Here is the outcome for the PSF FWHM increase with depth:
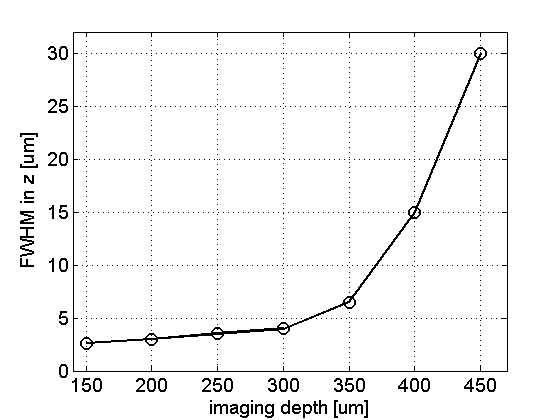
FWHM of excitation PSF with increasing imaging depth for g=0.9, NA=1.0 and mean free path = 200 um.
The result is qualitatively what I saw in the experiment: a seemingly exponential increase of the FWHM after maybe 1.5-2x of the mean free scattering path (200 um). This does not come totally unexpected, as the number of photons that are scattered in depth increase exponentially with depth. In the experiment, the curve rises earlier (i.e. at lower depth) to higher FWHM values, maybe due to additional scattering in the water above the surface or at the surface itself.
The obvious and expected outcome is that the PSF does not degrade linearly, but exponentially – good to keep in mind.
—
And here a brief description of the simulation method I used. (A work of a couple of hours only, since I have worked with the Greenstein-Henyey function before.) It is as coarse as you can do it. It assumes that photons are moving independently of each other on a linear trajectory and are scattered on average every 200 um. This somewhat undermines the idea of the PSF as diffraction-limited spot, but reduces the PSF to a scattering-limited spot, giving kind of a lower limit to the FWHM.
For scattering events, I used the usual scatter-angle distribution for an anisotropy factor g = 0.9 as is often assumed for brain tissue. See the plot below. It describes to which direction photons are scattered if a scattering event occurs.
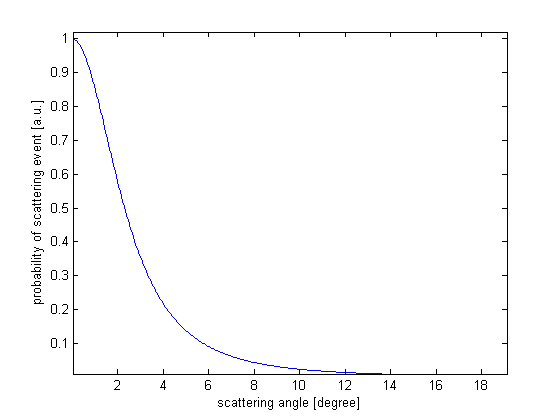
Scattering angle according to the Henyey-Greenstein function with an anisotropy factor of g = 0.9.
How does this look like in the simulation? Here are some movies of scattering in different depths (150, 300, 450 um; for a free mean path of 200 um assumed for the incoming IR light).This is a radial projection to 2D, with the beam being flat, and not Gaussian. Quite strange assumptions, but good enough to give a feeling of what happens:
In the end, I measured from these coarse simulations the FWHM in 2P mode (simply by taking the square of the photon distribution function, approximated by ca. 5000 light simulated traces), after convolving the axial integrated intensity with a Gaussian to somehow account for diffraction afterwards.
It is interesting how simple methods – leaving aside the wave nature of optical beams – can come to such results.
